Google Analytics for Ecommerce: A Beginners Guide
 Google Analytics is a valuable ally in the ecommerce battle for consumer dollars. The insights it provides contains a wealth of information about your site, your visitors and where they came from. All this information can be used to find new customers and increase conversions.
For many ecommerce entrepreneurs just starting out, Google Analytics can feel like a confusing mess of technical reports and information that’s difficult to navigate and understand.
In this post we will look at exactly how to set up Google Analytics for your store, the basic reports you should be checking and a few other goodies to help supercharge your knowledge and drive sales.
Why You Need Google Analytics
If you owned a physical storefront, you have the ability to see you customer. You can view their habits firsthand and speak with them. Without ecommerce analytics and relevant KPIs, websites leave you blind to much information about your visitors and customers you would ordinarily get to see.
Using Google Analytics can better help you understand the effectiveness of your marketing efforts, better understand your visitors and optimize your store for conversions and sales.
Getting Google Analytics Ecommerce Tracking Set Up
Google Analytics is fairly easy to set up but the exact steps to set it up will depend on your shopping cart. If you’re on the Shopify platform it’s as simple as creating a new account in Google Analytics, copying the tracking code, and pasting it into the Google Analytics field in your settings page.
Getting A Google Account
To get started with Google Analytics, you’ll first need a Google account. If you already have a Gmail account, you'll be able to use that. If not, create your Google account.
1. Go to the Google Analytics and click the create an account link in the top right corner.

2. Once you have signed in to Google Analytics, click on create new account. This will set up a new profile to track your ecommerce site analytics.
3. On the next screen, choose Website and complete the required details.
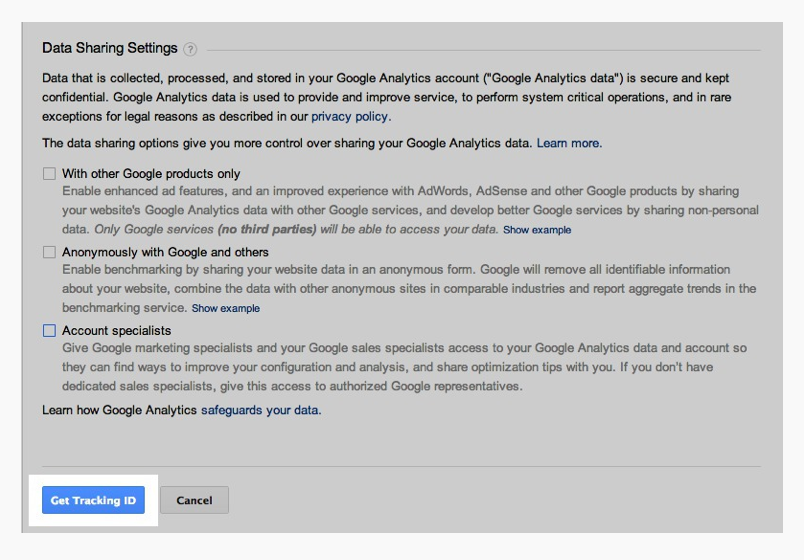
4. Click Get Tracking ID at the bottom of the page to get your tracking code.
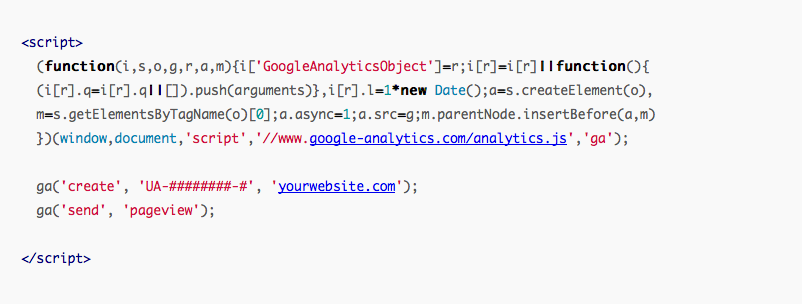
5. On the following page, you’ll need to copy the tracking code provided. It will look similar to the example below:
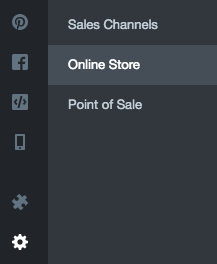
7. Open your Shopify store Admin and go to "Settings."
8. Paste the code you copied from Google Analytics into the field provided.

9. Once the code has been added to your site, the final step is to turn on the optional (but very important) ecommerce tracking feature in Google Analytics.
- Click Admin from the menu bar at the top of any screen in Google Analytics.
- Use the drop-down menus to select your account.
- Under the third column, click View Settings.
- Scroll down to the Ecommerce Settings section, and click the toggle so it says ON.
- Click Save at the bottom of the page.
Note: It can take up to 24 hours for Google Analytics to begin collecting information.
For more information and, step by step details to setting up Google Analytics on the Shopify platform, please refer to this Shopify documentation. If you’re on a platform other than Shopify, please refer to Google Analytics documentation.
Basic Reports
Google has a lot of reports and those reports can be sliced and diced a hundred different ways. Don’t get overwhelmed though. If you’re just starting out, the basic overview reports contain plenty of great information and insights to get started.
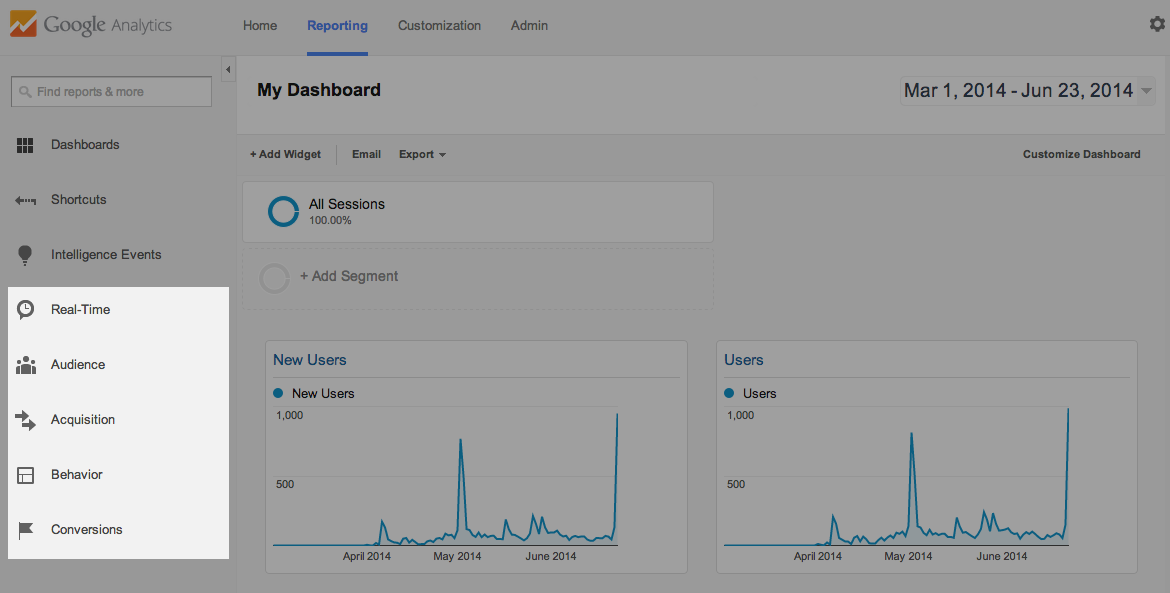
Report categories in Google Analytics are broken down on the left side menu. The most important sections you should get familiar with when just starting out are:
- Real-Time - Shows you what’s happening on your site in real time.
- Audience - Tells you more about who is on your site.
- Acquisition - Tells you how your visitors and customers found and arrived at your site.
- Behaviour - Tells you important information about your site and what your visitors are doing on your site.
- Conversions - Tells you more about your sales and conversions.
Below, we will highlight some of the most important and fundamental reports to know and understand if you’re just starting out. Once you understand these reports, you should feel more comfortable exploring other sections and reports in Google Analytics.
Keep in mind for all reports (with the exception of Real-Time reports), the default time period is the last 30 days. You can change the reporting period at any point by using the date selector in the top right-hand corner.
Real-Time Reports
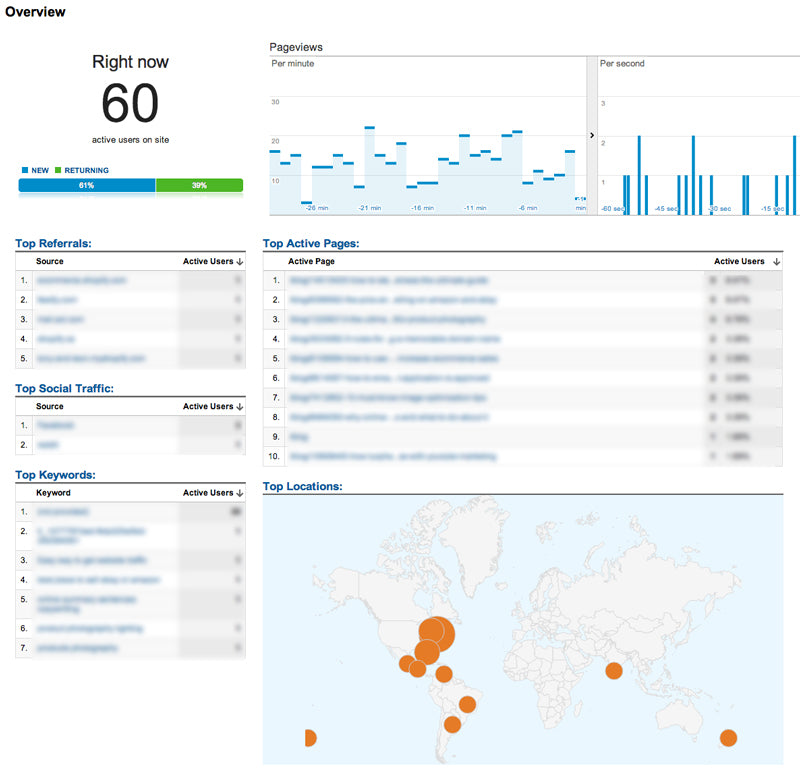
*Information above has been blurred for privacy reasons.
Real-Time reporting is a great tool for monitoring website traffic as it happens. This real-time report will show you who is on your site at that very moment, where they came from, their geographic location and what pages they're browsing.
Real-time is particularly useful for gauging how a social media post, email or campaign is performing, tracking the immediate impact of traffic to your site.
To see Real-Time reporting, click on Real-Time and then Overview in the left hand navigation bar. Overview will give you most of the information on one dashboard but you can drill down a little deeper by selecting one of the other reports under Real-Time, including Locations, Traffic Sources, Content, Events, and Conversions.
What Can You Do With This Information:
Real-Time analytics can be a bit of a novelty, however, there are a few ways you could use this information to make better decisions:
- See whether a promotion is driving traffic to your site, and which pages visitors are viewing.
- Monitor the immediate effects on traffic from a blog/email/social network post.
Audience Reports
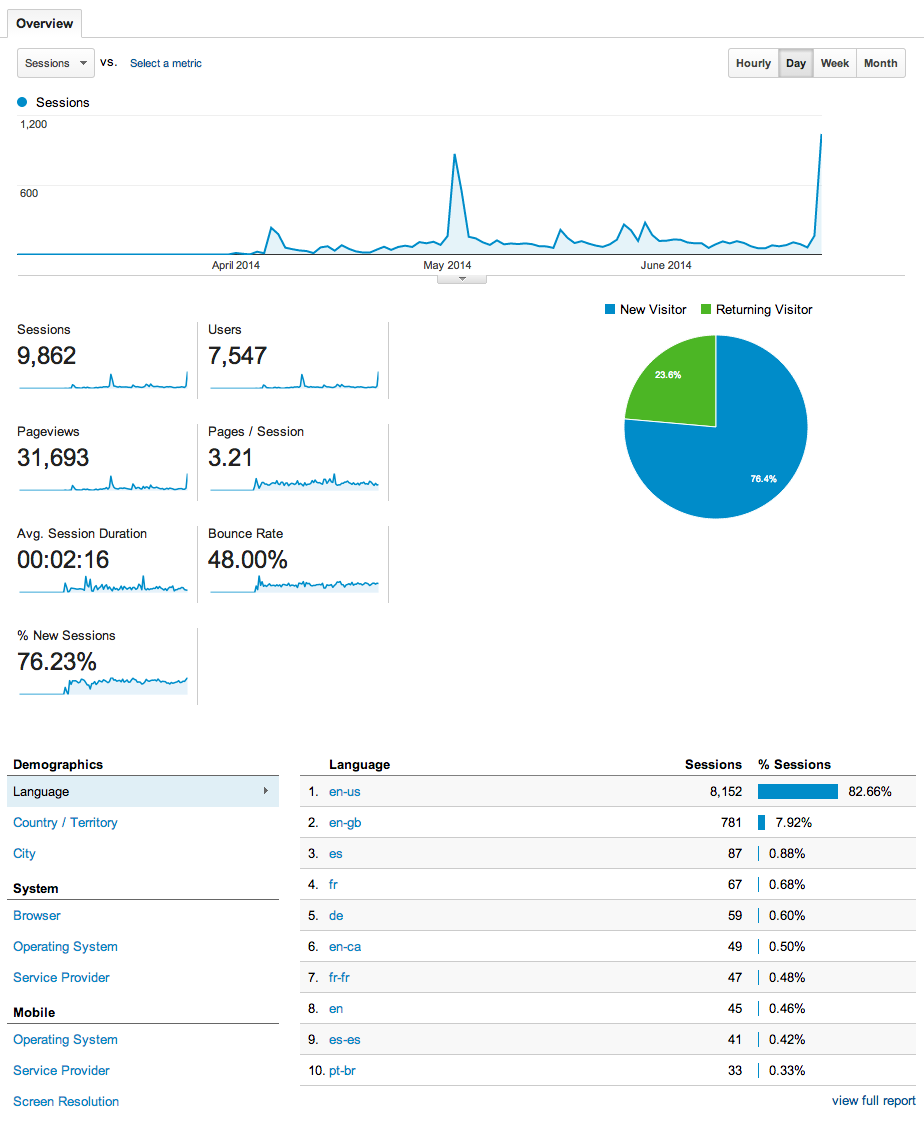
The Audience reports provide insight into the visitors to your ecommerce store, which can be a valuable source for marketing analytics and information. The various reports under Audience will provide you with in-depth insights into the demographics (age, gender), geography (language, location) as well as the technology they're using to access your site (Mac vs. PC, desktop vs. mobile).
In the Audience Overview report you can see the total number of visitors (referred to as sessions), new vs. returning users (pie chart), and information for each of the following metrics:
- Sessions - The total number of visitor “sessions” to your site
- Users - The total number of unique visitors to your site
- Pageviews - The total number of pages viewed on your site
- Pages per Session - The average number of pages viewed per session (visit)
- Average Session Duration - The average amount of time visitors stay on your
- Bounce Rate - Percent of visitors that leave your site after viewing only one page
- New Users - Percent of total visitors who arrived at your site for the first time
At the bottom of the Audience Overview report, you'll also see additional information on the following visitor metrics:
- Language
- Country/Territory
- City
- Browser
- Operating System
- Service Provider
- Mobile Operating System
- Mobile Service Provider
- Mobile Screen Resolution
Changing Segments
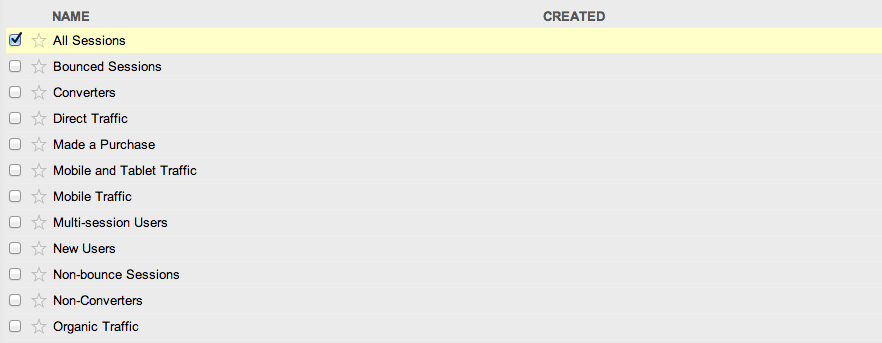
By default for all reports, Google Analytics will show you information for all traffic to your store, however, you can drill down and look at some more specific information. Google has predefined some popular segments for you that you can view by clicking on All Sessions at the top of your reports and selecting a new segment from the drop down at the top of any report.

Comparing Segments
Once you feel comfortable with this information, you may want to consider adding a segment. Adding a segment just means comparing information from one segment against another. For example, you can try comparing people that made a purchase to people that haven’t made a purchase in an attempt to understand the difference between these two segments.
To compare segments, click on All Sessions at the top of your reports and select your first segment, then click on + Add Segment to add another segment to compare.

What Can You Do With This Information:
The information in your Audience reports is valuable, offering key insights into your customer that you can use to move the needle for your business.
- The information about visitor countries can help you better understand interest from countries that you may not currently cater or ship to.
- Cities providers relevant information about which cities your visitors are visiting from. This can help you better understand and work out shipping logistics and better choose a fulfillment warehouse closer to the majority of your customers, reducing shipping time and costs.
- Browser/Operating System and Screen Resolution can help you understand how the majority of your customers are viewing your site so you can more sure your site is optimized and working correctly for the greatest number of visitors.
Acquisition Reports
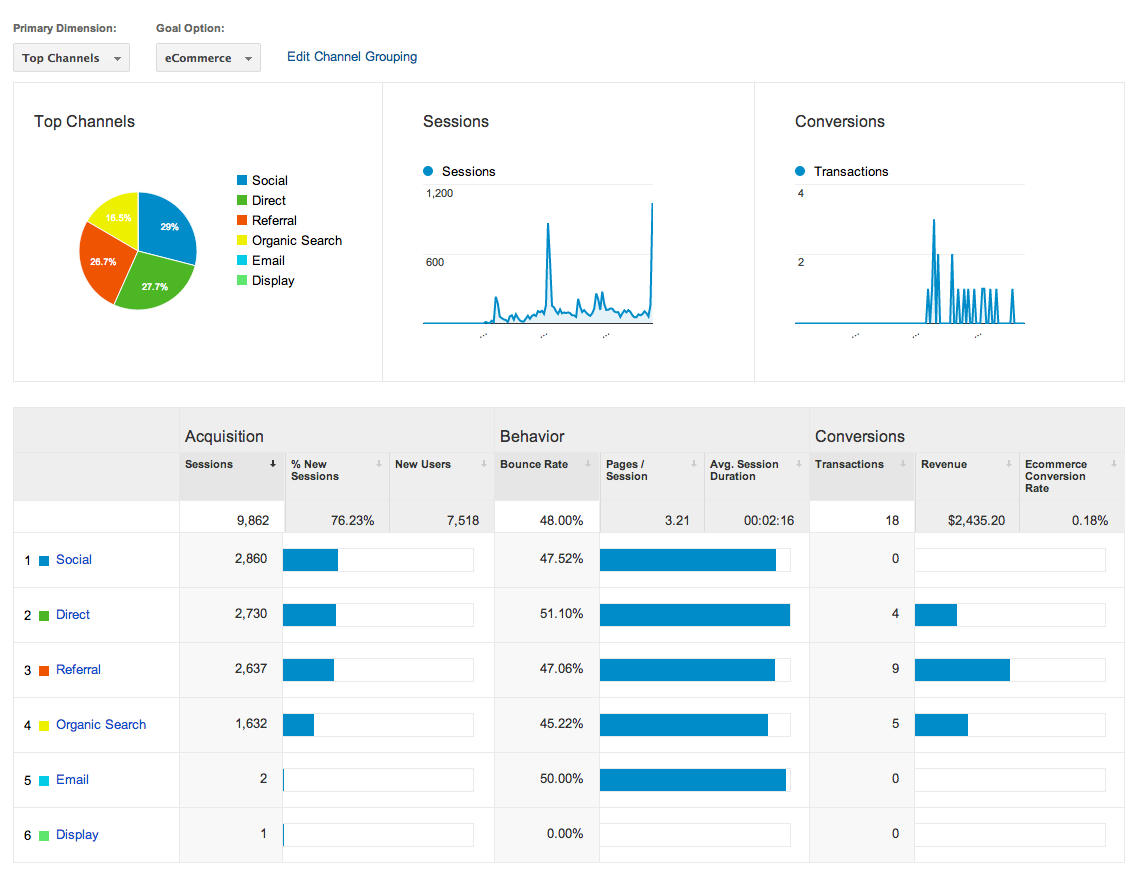
The Acquisition reports is really important because it provides information about how your visitors found you and how they arrived at your site. Understanding what's working (and not working) to drive visitors and customers can help you identify how to drive even more.
By default, the Acquisition Overview report will help you understand:
- Which channels drive the most visitors
- Which channels drive the visitors who engage most with your site the most
- Which channels drive the visitors who result in the most sales
Besides the Acquisition Overview report, you should also check out the All Referrals report on a regular basis. This report will show you pages and domains that are linking to your store and driving traffic.
What Can You Do With This Information:
Acquisition reports can provide some key understandings into how people are finding your site. In turn, this helps you figure out how to reach even more people.
- Knowing which channels are driving traffic and sales means you can focus on the channels that are most effective for you.
- Understanding what other websites are linking to you and the volume of traffic they're driving helps you to understand where other opportunities may exist.
Behavior Reports
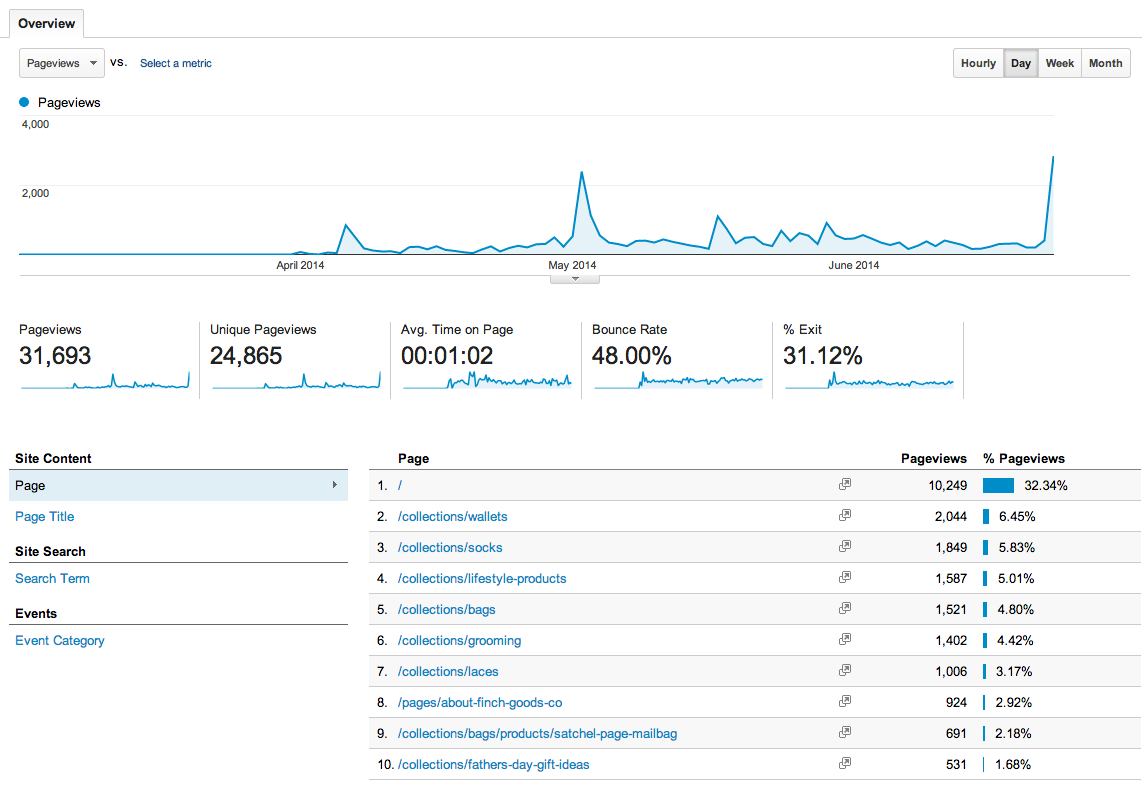
The Behavior reports section contains reports designed to help you improve the content on your site and how visitors are reacting to it. This includes information on the speed and load time of your pages, which can have an effect on your SEO.
Behavior reports can also help you identify the bounce rate of each page. Bounce rate, expressed as a percentage, refers to the amount of people that leave your site having only viewed one single page. This is usually an indication that they were confused or that they didn't find what they were looking for. Understanding which pages have the highest bounce rate can help you understand the pages that need to be looked at more closely.
What Can You Do With This Information:
Behavior reports can help you better understand areas of your site that need improvements. Understanding the information in these reports are key to creating a better experience for your visitors, thus increasing conversions.
Conversion/Ecommerce Reports
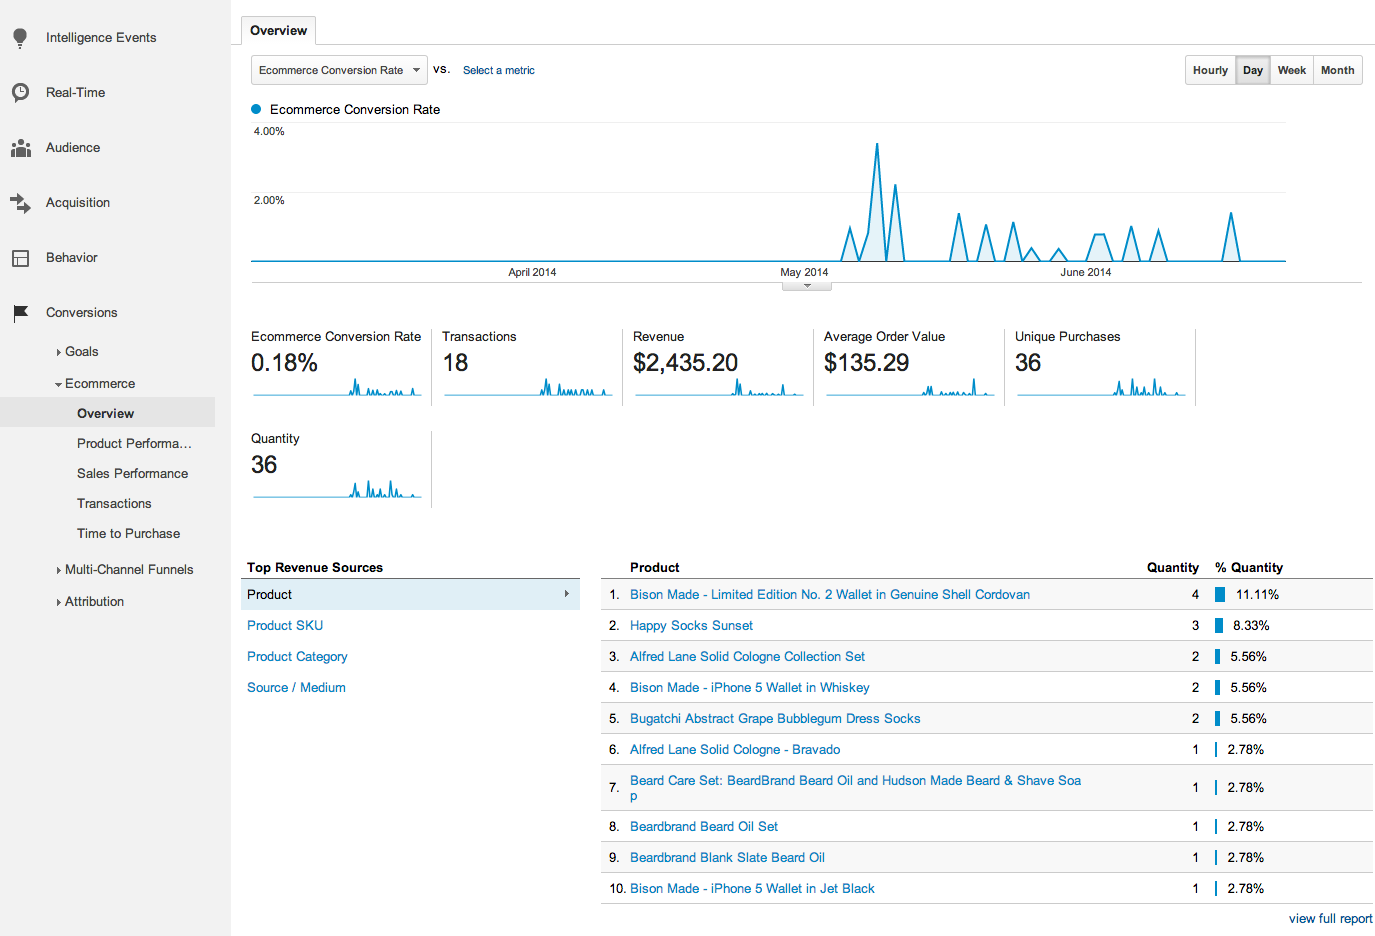
The Ecommerce reports under the Conversions menu is the reason you turned on Ecommerce Tracking in Google Analytics. Platform like Shopify will pass information about your products, sales and conversions to Google Analytics for further analysis.
Use Ecommerce Tracking to learn more about what visitors buy on your site, including information about:
- Products - Which products they buy, in what quantity, and the revenue generated by those products.
- Transactions - The revenue, tax, shipping, and quantity information for each transaction.
- Time to Purchase - The number of days and number of sessions it takes to purchase, starting from the most recent campaign through the completed transaction.
What Can You Do With This Information:
As you begin to make more and more sales, understanding those sales will become vital to helping you sell more.
- By understanding which products sell well you will better understand which of your products are best suited for your customer base and which ones are supported by your best marketing efforts.
- The revenue per transaction, and the number of products per transaction can help you better understand if you might benefit from offering better quantity discounts, or eliminating shipping costs if customers meet a minimum dollar amount.
Know What Your Customers Are Searching For With Site Search
If you carry a wide variety of products or have a large catalogue, search on your site is extremely valuable to your customers. But your search is can also be extremely valuable to you as well if you knew what your customers were searching for. Connecting your site search to Google Analytics can help you peer into the minds of your customers to know what they are looking for and what you might be missing.
To connect your search to Google Analytics:
- Login to your Google Analytics
- Click Admin in the top right-hand side of your screen
- Select the account
- Click View Settings
- Turn on Site Search Tracking
Before you click save, there is one final step. You still need to find out how your site identifies search terms. Your site uses what’s called a query parameter for this. Google Analytics needs to know to look for the same query parameter.
How to Find Your Search Query Parameter
Go to your website and search for something. On the search results page, look at the URL and find your search term.
For example, you may get a URL like this if you searched your store for the term "example search":

Just prior to the term you searched for in the URL, you should see an “=” preceded by a letter, in this case "q". This letter is the parameter for your site search.
Once you know what letter or word your search query parameter is, type it into the Query Parameter box in the Site Search Settings of Google Analytics and save.
You have now set up Google Analytics to watch for and record what people search for on your site. It can sometimes take up to 24 hours for data to start coming in for site searches so be patient.
When some time has passed and you're ready to see what your visitors have been searching for on your site, you can find the report under Behavior - Site Search - Search Terms.
For more information on Google Analytics Site Search, please refer to the official Google documentation.
Campaigns
One of the most important things to track in Google Analyics is your marketing campaigns. Google Analytics allows you to quickly create and automatically track campaigns but simply using a special URL.
All you have to do to track campaigns automatically is use Google’s Campaign URL Builder tool to create a trackable URL.
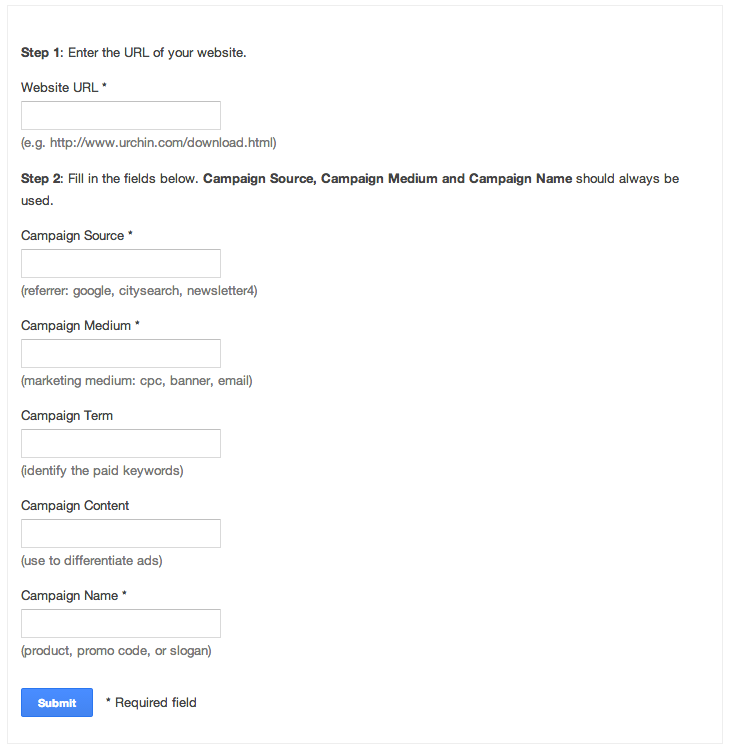
To use this tool, you simply need to enter the link you want to track and a bit of information to describe your campaign. After you complete this information, Google will provide you with a trackable link to use.
As you use the URL's that you built for your various campaigns, Google Analytics tracking will automatically recognize and tag the campaigns.
To see all the information on how your campaigns are preforming, just go to Acquisition - Campaigns.
Knowing Is Half The Battle
Google Analytics can be intimidating. The thought of a bunch of data, graphs and charts can be scare a lot of people off when first diving into it. However, understanding fundamental metrics of your site and your visitors is absolutely crucial to growing and scaling your business.
This guide should have helped you become more familiar with some of the basics of Google Analytics and assist in breaking down the wall of data intimidation.
